This quickstart assumes you know how to install Ubuntu and access it through a terminal (command line).
EDIT: There seems to be a bug with the latest stable version of Grafana (2.6) and running on a headless system such as the one I’m describing here (Ubuntu Server). This bug causes icons not to be displayed in the web interface. I would suggest either using Ubuntu Desktop (I have not tested this myself) or using Grafana 3 which does not have this bug (I tested this and it does work on Ubuntu Server 16.04. I’ve updated the Grafana installation instructions to include version 3 as well).
Ubuntu Configuration
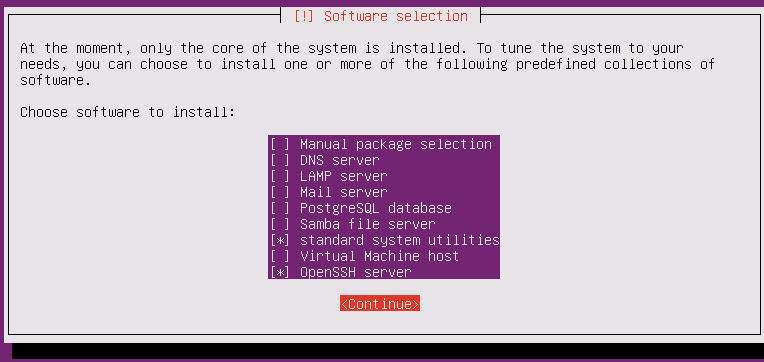
I started with a new installation of Ubuntu Server 16.04 LTS 64bit. During installation, when prompted for which predefined collections of software to install, only “standard system utilities” and “OpenSSH server” were selected.
After a clean installation, run:
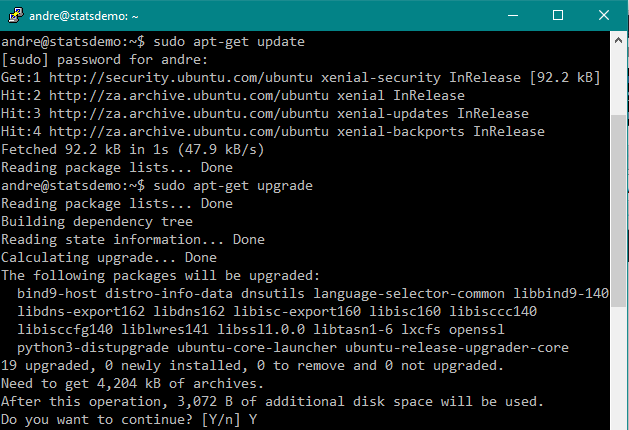
sudo apt-get update
and
sudo apt-get upgrade
Install InfluxDB
The instructions below are based on the official documentation which can be found here: https://docs.influxdata.com/influxdb/v0.12/introduction/installation/
First, configure the package sources.
Make sure you’ve previously used sudo in the current session, so that the sudo in the command below does not prompt you for a password again. To make sure, you can just run “sudo ls” and check that it doesn’t prompt for a password.
If you copy and paste this, make sure it is three separate lines.
curl -sL https://repos.influxdata.com/influxdb.key | sudo apt-key add -
source /etc/lsb-release
echo "deb https://repos.influxdata.com/${DISTRIB_ID,,} ${DISTRIB_CODENAME} stable" | sudo tee /etc/apt/sources.list.d/influxdb.list

This will create a file called “/etc/apt/sources.list.d/influxdb.list” if it worked.
Then install InfluxDB:
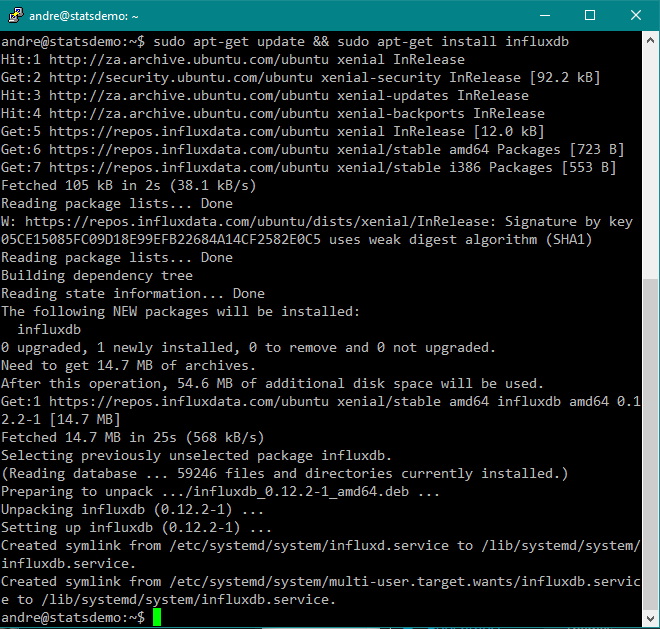
sudo apt-get update && sudo apt-get install influxdb
Start InfluxDB. This command produces no output.
sudo service influxdb start
Connect to InfluxDB using the commandline
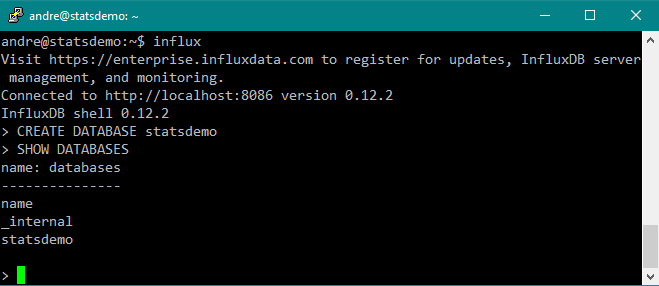
influx

Create a database. For this quickstart we’ll call the database “statsdemo“. Run this command inside the InfluxDB shell.
CREATE DATABASE statsdemo
This command produces no output, but when you list the database, you should see that it was created:
SHOW DATABASES
Select the new created database:
USE statsdemo

Insert some test data using the following command.
INSERT cpu,host=serverA value=0.64
More information about inserting data can be found here: https://docs.influxdata.com/influxdb/v0.12/guides/writing_data/
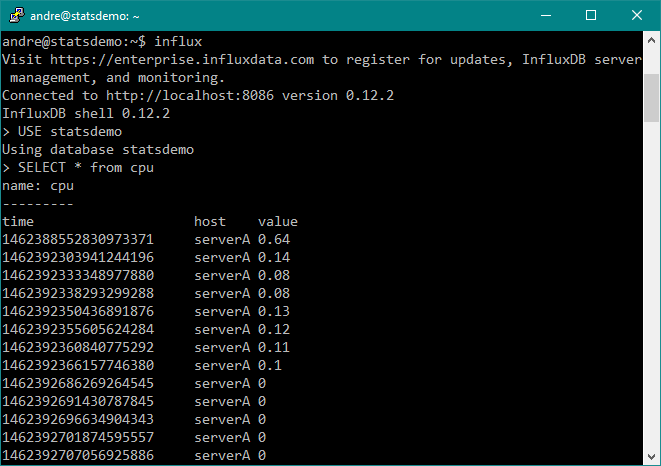
The insert command does not produce any output, but you should see your data when you perform a query:
SELECT * from cpu

Type “exit” to leave the InfluxDB shell and return to the Linux shell.
exit
Writing test data
To have some data to play with we need to write something to the database.
Open another terminal and run this one line script. It will continue running until you press CTRL-C and write the current load average of your Ubuntu server every 5 seconds to the database, using the HTTP API of InfluxDB.
curl -i -XPOST 'http://localhost:8086/write?db=statsdemo' --data-binary 'cpu,host=serverA value=`cat /proc/loadavg | cut -f1 -d" "`'
It will print out something every 5 seconds. Just let it run and collect some data while you do the next steps.
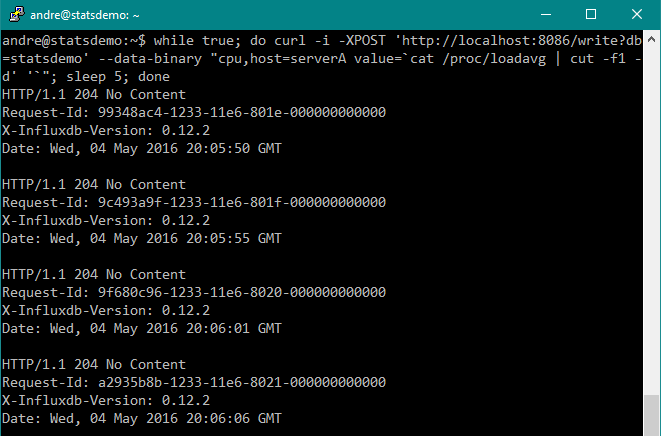
You can verify if data is being sent to InfluxDB by using the influx shell and running a query. Note that if your server is not very busy, you’ll see a lot of zeros being logged for the load average!
influx
USE statsdemo
SELECT * FROM cpu
Install Grafana
The instructions below are based on the official documentation, available here: http://docs.grafana.org/installation/debian/
Configure package sources. You can either install the latest stable version (2.6 currently), or the Beta/Testing version (3.0 beta currently).
Due to a bug with 2.6 and Ubuntu 16.04 Server, I recommend using the beta version if you’re using Ubuntu Server in a headless configuration (No X).
For the current Stable version (2.6), use:
echo "deb https://packagecloud.io/grafana/stable/debian/ wheezy main" | sudo tee /etc/apt/sources.list.d/grafana.list
curl https://packagecloud.io/gpg.key | sudo apt-key add -
For the beta version (3.0) use:
echo "deb https://packagecloud.io/grafana/testing/debian/ wheezy main" | sudo tee /etc/apt/sources.list.d/grafana.list
curl https://packagecloud.io/gpg.key | sudo apt-key add -

Update package repositories and install Grafana:
sudo apt-get update && sudo apt-get install grafana
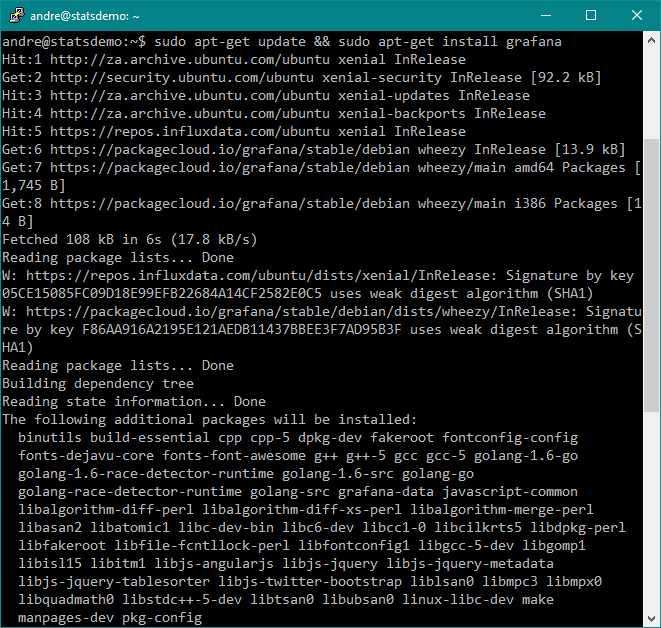
Start the grafana server:
sudo service grafana-server start
Configure Grafana
These instructions are for Grafana 2.6, but if you installed the beta version it is very similar.
Then use a webbrowser to connect to grafana, using the hostname or IP of your Ubuntu server and port 3000. Log in with admin/admin:
http://statsdemo:3000/
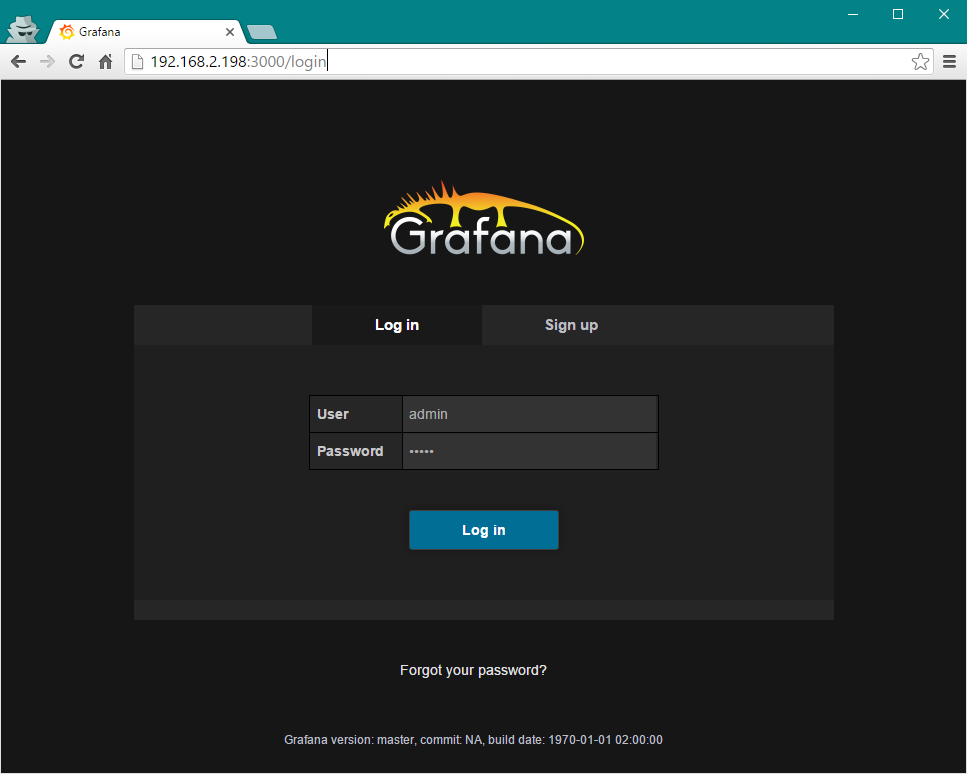
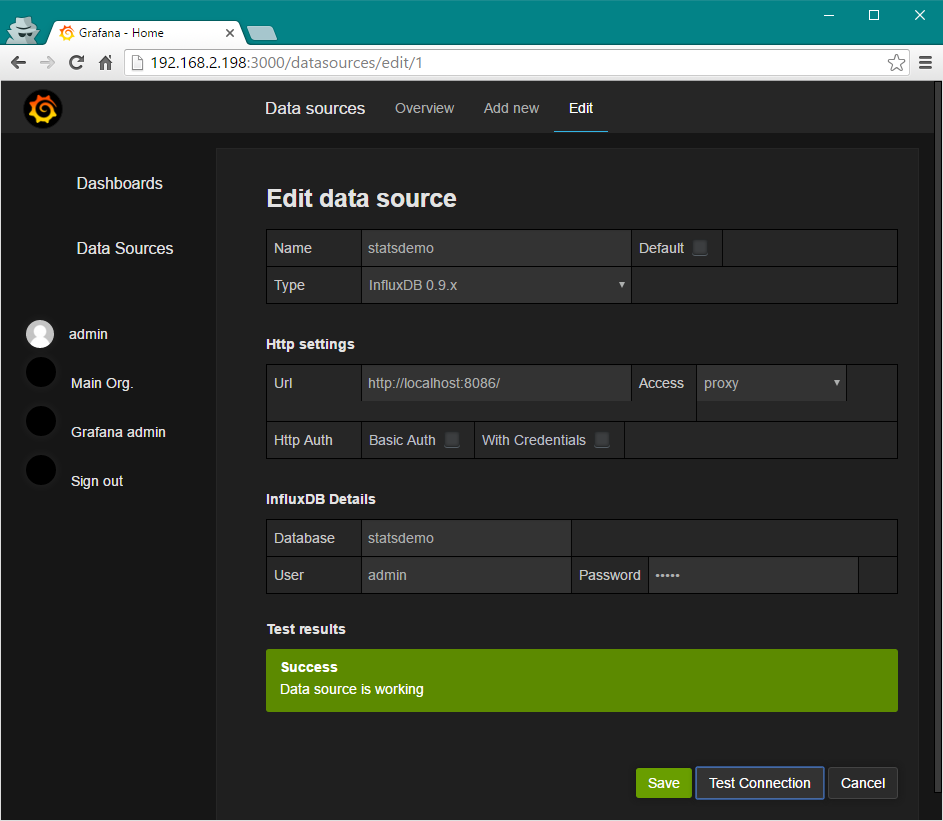
After logging in. click on Data Sources in the left menu, and then on Add New in the top menu to add a new datasource.
Choose the following options and click Add. Note: If you’re using Grafana 3.0, the Type will just be “InfluxDB”
Name: statsdemo
Type: InfluxDB 0.9.x
Url: http://localhost:8086/
Database: statsdemo
User: admin
Password: admin
After adding the datasource you will get a Test Connection button at the bottom, which you can use to verify if your settings are correct.
Create a Dashboard
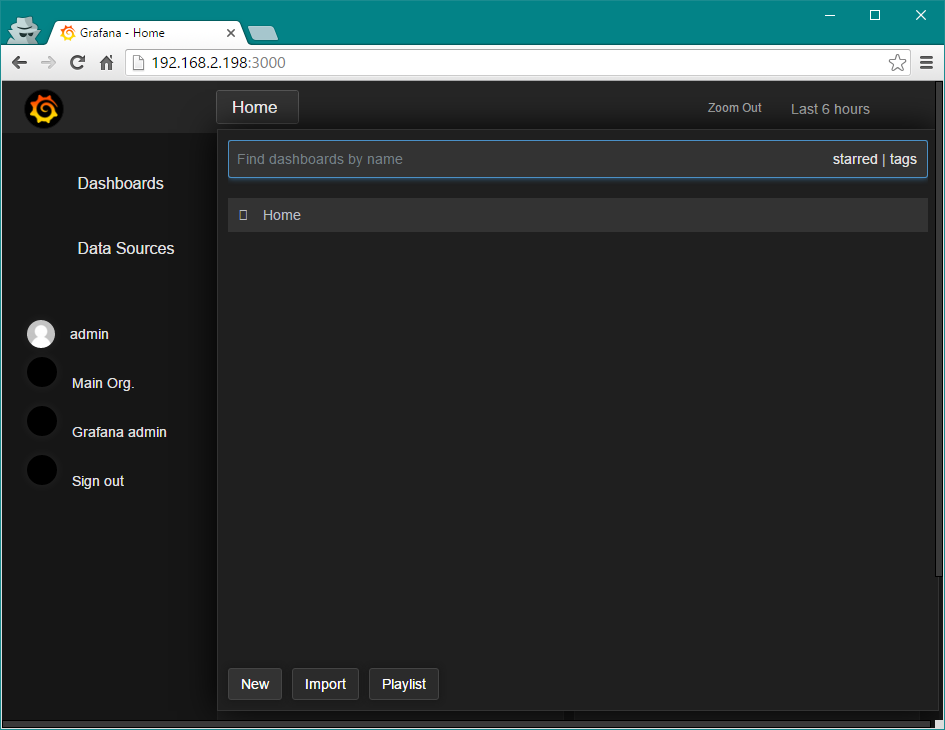
Click on the Dashboards link in the left menu, then the Home menu in the top to get a list of dashboards. Click the New button at the bottom to create a new dashboard.
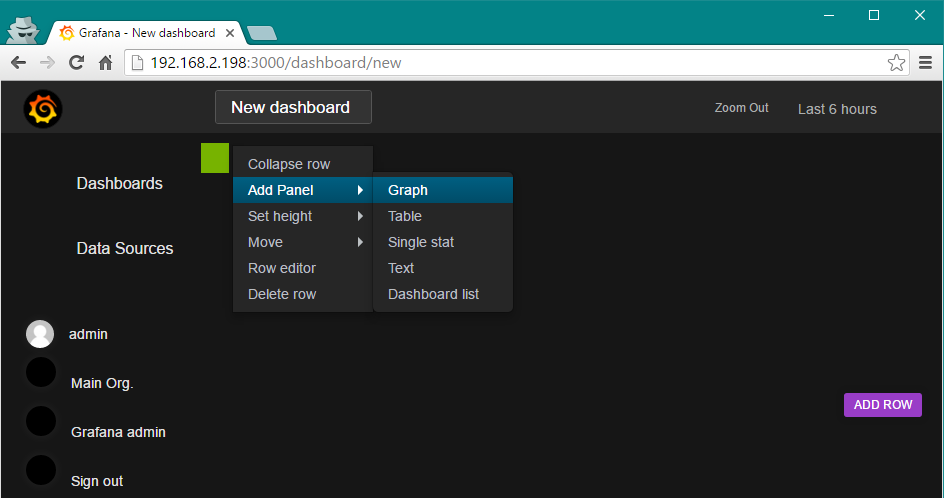
You will get a page with a green rectangle which expands if you hover your mouse cursor over it. If you click it it opens a submenu. Select Add Panel -> Graph from this menu.
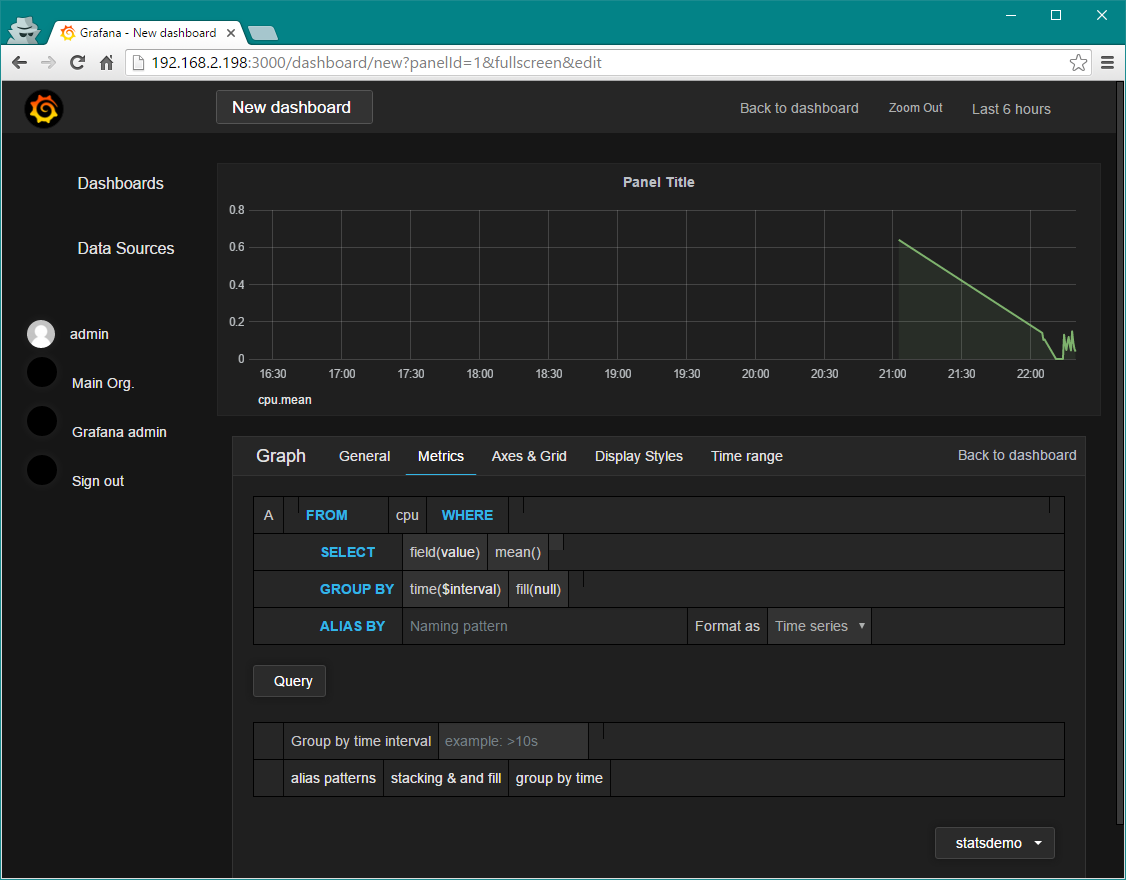
A sample panel with a graph will appear. With Metrics selected (it should be selected by default), there is a dropdown where you can choose a datasource. Choose statsdemo. A query will be displayed. Click on ‘select measurement’ to choose a measurement from the database. In this case the only one there is the sample data we inserted, called cpu.
As soon as you select the measurement Grafana will pull the data from InfluxDB and update the graph.
Go to the General tab, and give the panel a better name, for example “CPU Load Average”, and then save the dashboard by clicking on the Save Dashboard icon next to “New dashboard”. (Note there’s a bug in my installation, and the icon does not display, however, if I hover the mouse icon there I get a tooltip saying ‘Save Dashboard).
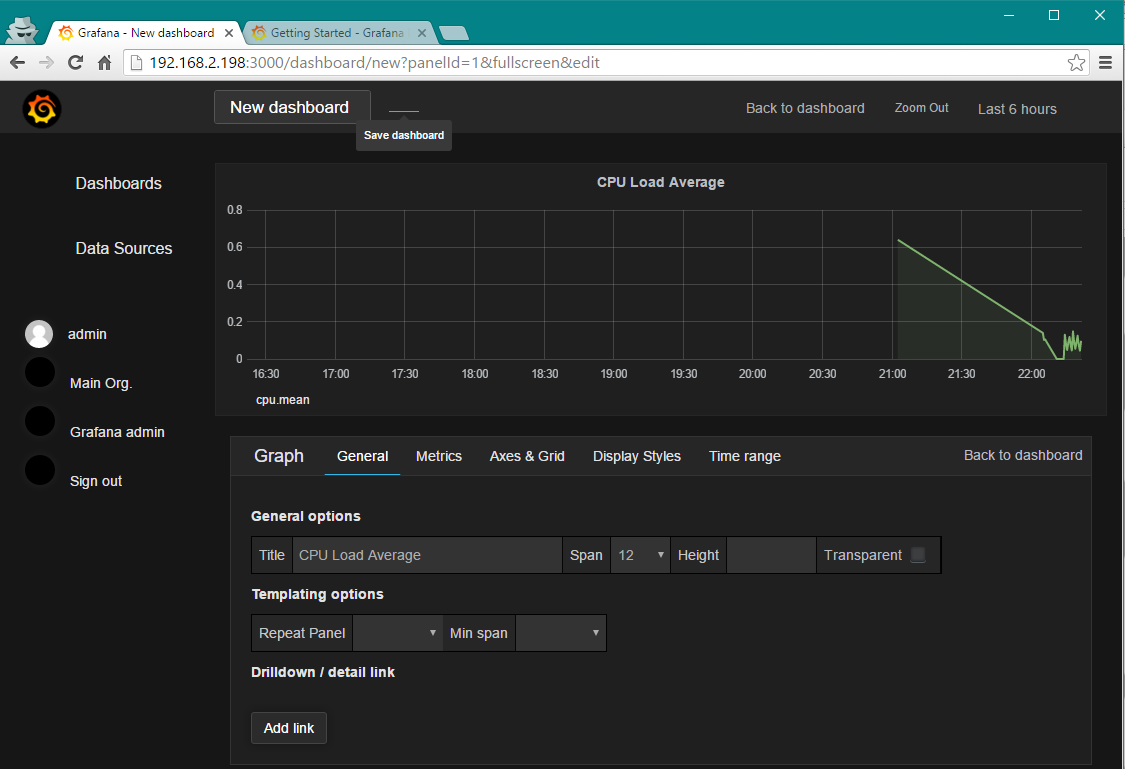
That’s it for now. This dashboard will continue updating as new data is written to InfluxDB.
You have a typo in your syntax to copy..
while true; do curl -i -XPOST ‘http://localhost:8086/write?db=statsdemo’ –data-binary “cpu,host=serverA value=`cat /proc/loadavg | cut -f1 -d’ ‘`”; sleep 5; done
Great post! It was just what I was looking for.
I did have some trouble with single/double quote use in the pasted “Writing Test Data” script, though. Terminal whined about an “invalid boolean,” unable to parse. What’s in the console screenshot works, so I used that.
For other Terminally-challenged people, the code ends up being:
while true; do curl -i -XPOST ‘http://localhost:8086/write?db=statsdemo’ –data-binary “cpu,host=serverA value=`cat /proc/loadavg | cut -f1 -d’ ‘`”; sleep 5; done
“`bash
while true; do curl -i -XPOST ‘http://localhost:8086/write?db=statsdemo’ –data-binary “cpu,host=serverA value=`cat /proc/loadavg | cut -f1 -d’ ‘`”; sleep 1; done
“`
Please don’t consider this code: the publisher makes a ticks change and it is unusable 🙁
This worked for me:
while true; do curl -i -XPOST http://localhost:8086/write?db=statsdemo –data-binary “cpu,host=serverA value=`cat /proc/loadavg | cut -f1 -d’ ‘`”; sleep 5; done
Is not working for me:
{“error”:”unable to parse ‘cpu,host=serverA value=`cat /proc/loadavg | cut -f1 -d\” \”`’: invalid boolean”}
InfluxDB shell version: 1.0.2
Not working for me:
{“error”:”unable to parse ‘cpu,host=serverA value=`cat /proc/loadavg | cut -f1 -d\” \”`’: invalid boolean”}
InfluxDB shell version: 1.0.2
You need to replace this:
curl -i -XPOST ‘http://localhost:8086/write?db=statsdemo’ –data-binary ‘cpu,host=serverA value=`cat /proc/loadavg | cut -f1 -d” “`’
by this:
curl -i -XPOST “http://localhost:8086/write?db=statsdemo” –data-binary “cpu,host=serverA value=`cat /proc/loadavg | cut -f1 -d’ ‘`”
Because you can not run backtick inside singe quote: not ‘“’ but ““”
Screenshot is right, but text is wrong.
on ubuntu 16 here is what works :
while true ; do curl -iv -XPOST http://192.168.234.128:8086/write?db=statsdemo –data-binary “cpu,host=serverA value=`cat /proc/loadavg | cut -f1 -d’ ‘`”; sleep 60; done
curl -i -XPOST ‘http://localhost:8086/write?db=statsdemo’ –data-binary ‘cpu,host=serverA value=`cat /proc/loadavg | cut -f1 -d” “`’
HTTP/1.1 400 Bad Request
Content-Type: application/json
Request-Id: 63acdd7b-1e41-11e7-803f-000000000000
X-Influxdb-Version: 1.2.2
Date: Mon, 10 Apr 2017 22:59:45 GMT
Content-Length: 108
{“error”:”unable to parse ‘cpu,host=serverA value=`cat /proc/loadavg | cut -f1 -d\” \”`’: invalid boolean”}
Please where is the problem?
I use ubuntu 16.04.
curl -i -XPOST ‘http://localhost:8086/write?db=statsdemo’ –data-binary ‘cpu,host=serverA value=`cat /proc/loadavg | cut -f1 -d” “`’
HTTP/1.1 400 Bad Request
Content-Type: application/json
Request-Id: 63acdd7b-1e41-11e7-803f-000000000000
X-Influxdb-Version: 1.2.2
Date: Mon, 10 Apr 2017 22:59:45 GMT
Content-Length: 108
{“error”:”unable to parse ‘cpu,host=serverA value=`cat /proc/loadavg | cut -f1 -d\” \”`’: invalid boolean”}
________________________________________
when I use this command :
curl -i -XPOST “http://localhost:8086/write?db=statsdemo” –data-binary “cpu,host=serverA value=`cat /proc/loadavg | cut -f1 -d’ ‘`”
cut: the delimiter must be a single character …
Please where is the problem?
Hi, I created a database based on influxdb then I installed grafana. I chose data source my database. But I can not get a graph in my dashboard.
can you help me
I have the exact same problem.
The below scrpted worked for me:
while true; do curl -i -XPOST ‘http://localhost:8086/write?db=statsdemo’ –data-binary “cpu,host=serverA value=`cat /proc/loadavg | cut -f1 -d’ ‘`”; sleep 5; done
If this doesn’t try manually typing it out from the screenshot above.
This is better, no smart quotes.
while true; do curl -i -XPOST ‘http://localhost:8086/write?db=statsdemo’ –data-binary ‘cpu,host=serverA value=’`cat /proc/loadavg | cut -f1 -d” “`; sleep 5; done
while true; do curl -i -X POST –data-binary “cpu,host=serverA value=`cat /proc/loadavg | cut -f1 -d’ ‘`” “http://localhost:8086/write?db=statsdemo”; sleep 5; done
I am trying to plots graphs in Grafana and seeing below error :
Invalid interval string, expecting a number followed by one of “Mwdhmsy”.
Could you please help ?
Kind of a mess getting the influx dummy data in… here’s what worked for me:
”’
while true ; do curl -iv -XPOST ‘http://localhost:8086/write?db=statsdemo’ –data-binary “cpu,host=serverA value=`cat /proc/loadavg | cut -f1 -d’ ‘`”; sleep 5; done
”’
Hi, I don’t get it yet :/
curl -i -XPOST http://localhost:8086/write?db=premium_stats –-data-binary “cpu,host=premium value=`cat /proc/loadavg | cut -f1 -d’ ‘`”
output;
curl: (6) Could not resolve host: –-data-binary
curl: (6) Could not resolve host: cpu,host=premium value=0.04
any help? 🙂
…. value=`cat /dev/ttyUSB0 | cut -f1 d” “` – not act. Is it possible for DS18b20+ESP8266 ?
https://pastebin.com/BpKG6y7b (posted the code on pastebin)
THANK YOU!!!
while true ; do sudo curl -i -XPOST ‘http://localhost:8086/write?db=statsdemo’ –data-binary “cpu,host=serverA value=$(less /proc/loadavg | colrm 4)” ; sleep 5; done
I’m getting
:~$ while true ; do sudo curl -i -XPOST ‘http://localhost:8086/write?db=statsdemo’ –data-binary “cpu,host=serverA value=$(less /proc/loadavg | colrm 4)” ; sleep 5; done
curl: (1) Protocol “‘http” not supported or disabled in libcurl
curl: (3) Failed to convert –data-binary to ACE; string contains a disallowed character
curl: (3) Failed to convert “cpu,host=serverA to ACE; string contains a disallowed character
curl: (3) Failed to convert value=1.4” to ACE; string contains a disallowed character
Any ideas?